Reviewing your first click test results.
To begin navigate to the Results tab of your project.
At the top of the page, the number of active participants and total participants is shown (e.g. 3 of 5). The average task completion time is also shown. Any filters that have been applied, such as survey results filters, will change the number of active participants that are being aggregated in the results.
Your first click test results are overlaid on the image that was shown to participants. You can toggle between seeing them as a heat-map or a point-map.
Defining regions
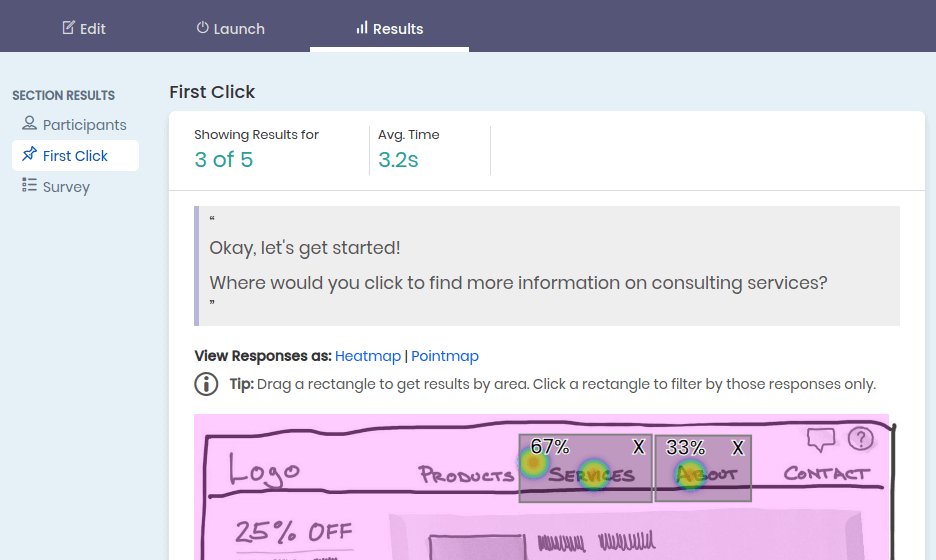
Define a region of your interface and determine the percent of participants to who clicked in that region.
- Drag a rectangle on the image to create a ‘click area’ - statistics of the % of people who clicked within that area will be seen.
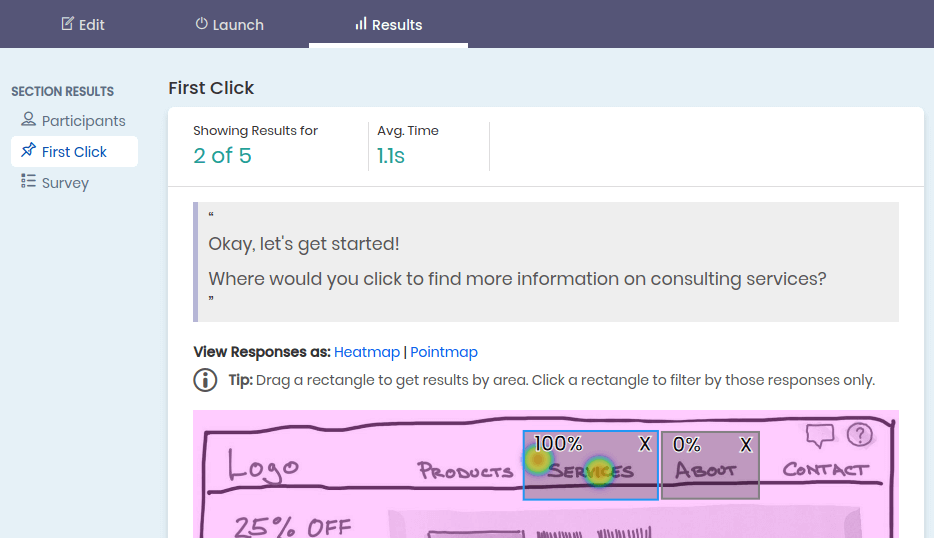
- Clicking on the region you defined will further filter your test by only those participants. The border of the filtered region will turn blue . Clicking again will turn off the filter.
Example of a filtered first click region